Seven Sales Metrics Worth Tracking in 2026, and How to Act on Them
Stop drowning in dashboards. Here are seven sales metrics that help you see where revenue is heading, how to set a target for each from your own history, and how to act on them.
Most sales dashboards grow until nobody uses them. Every tool adds its metrics, every meeting adds a chart, and soon a weekly review means scrolling through dozens of tabs that change nobody's behavior.
A short list of metrics that the team actually reviews and acts on is usually more useful than a long dashboard nobody opens. This framework uses seven. Adjust the list to your sales motion, and be wary of adding metrics nobody will act on.
Why Most Sales Dashboards Fail
The pattern is familiar:
- 1Someone buys an analytics tool.
- 2Every metric the tool offers gets added, because it is already paid for.
- 3Weekly meetings become long data reviews where everyone nods and nothing changes.
- 4Reps game the metrics that get attention.
- 5Revenue stays flat while the dashboards look polished.
A common problem is confusing activity metrics with outcome metrics, and lagging indicators with leading indicators. Teams measure what is easy to count instead of what tells them where revenue is heading.
Time is the other constraint. In Salesforce's seventh State of Sales survey, reps reported spending more than half of their time on nonselling work like data entry and prospecting [2]. A metrics process that adds reporting work makes that worse.
If your Monday meeting starts with "how many calls did everyone make last week," you are measuring effort, not results. A rep who made fewer calls and booked more qualified meetings is outperforming the rep with the bigger activity count.
The 7 Metrics
They fall into two groups: leading indicators you can influence now, and outcome indicators that confirm whether the leading indicators are working.
Leading Indicators
#### 1. Pipeline Coverage Ratio
This answers one question: is there enough qualified pipeline to hit the number?
Formula: Qualified pipeline value for the period / Quota for the period
Do not borrow a target. Derive it from your own history. If your team historically wins about one in four qualified opportunities by value, you need roughly four times quota in qualified pipeline to expect to land the number. If you win one in three, you need about three times.
| Coverage vs. Your Required Ratio | What It Means | Action |
|---|---|---|
| Well below required | Quota is unlikely without new pipeline | Start pipeline generation now |
| Slightly below required | One or two slips and you are short | Increase outreach to priority accounts |
| At or above required | Healthy if the pipeline is real | Focus on conversion |
| Far above required | Pipeline may be inflated or deals stalling | Audit pipeline quality |
Check coverage every week. If a rep falls below the required ratio with weeks left in the quarter, build a recovery plan that day.
Common mistake: counting stale or unqualified deals. If a deal has had no buyer activity in a month, remove it from the calculation. An honest coverage number should feel slightly uncomfortable.
#### 2. Positive Reply Rate
How many outreach attempts produce a positive human response. Not opens, not clicks.
Formula: Positive replies / Prospects contacted
Exclude opt-outs and "wrong person" replies, which inflate total reply rate without creating pipeline. This is a leading indicator because it sits at the top of the funnel: if it falls, pipeline dries up weeks later.
The usual causes: targeting the wrong persona, leading with features instead of the prospect's specific problem, and sending the same sequence to every industry and role. Fix these before you touch subject lines.
#### 3. Meeting-to-Opportunity Conversion Rate
Whether the meetings you book are worth having.
Formula: Qualified opportunities created / First meetings held
Track the trend against your own baseline. When it drops, check two things: are reps meeting decision-makers or anyone who says yes, and are they running discovery or jumping straight to a demo? Demo-first meetings with unqualified prospects end in "looks interesting" and silence.
#### 4. Sales Cycle Length by Deal Size
Days from first meaningful conversation to closed-won, tracked separately by deal size tier. A small deal and a large one should not share an expectation.
| Deal Size Tier | How to Set the Expectation | Warning Sign |
|---|---|---|
| Small | Median cycle of closed-won small deals over the last year | Deals running well past the median |
| Mid-size | Median for this tier | A growing share of deals past the median |
| Large | Median for this tier | Long gaps between stage changes |
| Strategic | Review deal by deal | No clear next step agreed with the buyer |
Cycle length creep is quiet. A few extra days here, another reviewer there, and deals start slipping into next quarter.
How to use it: when a deal runs half again as long as the median for its tier, review it. Not to pressure the rep, but to find what stalled: usually a missing stakeholder, unclear next steps, or a champion who went quiet.
Outcome Indicators
#### 5. Win Rate by Stage
Overall win rate is useful. Win rate by stage transition is where coaching insight lives.
Formula: Deals that advanced / Deals that entered each stage
Map the conversion at every transition, for example discovery to demo, demo to proposal, proposal to negotiation, and negotiation to close. Look for the largest drop. If deals stall between demo and proposal, look at what happens there: how long proposals take, whether pricing is clear, whether the right stakeholders saw the demo.
Map conversion at each stage transition. The biggest single drop is your highest-value coaching opportunity. Fix that stage before trying to improve every stage a little.
#### 6. Customer Acquisition Cost (CAC)
Formula: (Sales costs + Marketing costs) / New customers acquired
Finance cares about this metric most and sales leaders often ignore it. Knowing your CAC helps you argue for budget, justify headcount, and choose which segments to target.
What to include:
- all sales compensation, base and variable;
- sales tools and software;
- marketing spend attributed to pipeline;
- SDR and BDR team costs; and
- enablement and training.
Track CAC payback, the months of customer gross margin needed to recover acquisition cost, and agree an acceptable payback period with finance for each segment.
#### 7. Revenue per Ramped Rep
Formula: New business revenue / Number of fully ramped reps
Define "ramped" consistently, for example reps who have carried a full quota for at least two quarters.
Total revenue can grow just by adding headcount. Revenue per ramped rep shows whether the system is getting better. If the team doubles and revenue per rep stays flat, you spent more without improving.
Share the distribution with the team. The gap between the median and the top performers opens natural coaching conversations about what the top group does differently.
The Vanity Metrics Graveyard
Calls made and emails sent: without conversion context, these reward busy work.
Email open rates: unreliable. Apple says Mail Privacy Protection prevents senders from seeing if you have opened the email message they sent [1], so many recorded opens do not mean a person read anything.
LinkedIn connection count: a large network means nothing if it is not your ICP.
Demos given: rewards demoing unqualified prospects. Track demo-to-opportunity conversion instead.
Pipeline created without a quality filter: pipeline that appears on Monday and disappears by Friday was never real. Track qualified pipeline only.
Building Your Review Cadence
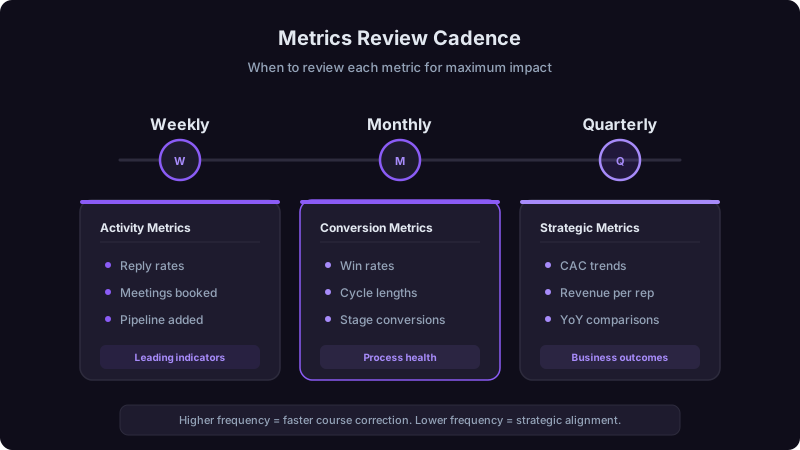
Review too often and you react to noise. Review too rarely and you find problems after they hit revenue.
Leading indicators only:
- pipeline coverage per rep against the required ratio;
- positive reply rate for active sequences;
- meetings booked against plan; and
- deals at risk of stalling.
No deep analysis. Are we on track, and what is the one thing each rep needs to do this week?
- win rate by stage;
- sales cycle trends by tier;
- meeting-to-opportunity conversion; and
- a pipeline quality audit.
Come with hypotheses, not just data: "If the proposal stage is where deals stall, is it because we started selling to a new segment without changing the proposal format?"
- CAC and payback trends;
- revenue per ramped rep against previous quarters;
- year-over-year comparisons;
- tool and process return; and
- hiring plan changes based on productivity.
A Framework for Acting on Metrics
For every metric, answer five questions:
| Question | Example (Win Rate by Stage) |
|---|---|
| What is the current number? | Demo-to-proposal conversion from last quarter |
| What is the target? | A target agreed from your best recent quarter |
| What influences it? | Proposal speed, stakeholder mapping, pricing clarity |
| What experiment will we run this month? | Same-day proposals for smaller deals |
| How will we measure it? | Compare conversion for same-day and delayed proposals |
Do not try to improve all seven metrics at once. Pick the one furthest from target with the largest revenue impact, fix it, then move to the next.
Your Move
Audit your dashboard this week. Count the metrics. For each one, ask: "If this number changed significantly, would I do something different?" If the answer is no, remove it. What remains should be a list short enough to review every week.
References
[1]Apple Support, Use Mail Privacy Protection on iPhone. https://support.apple.com/guide/iphone/use-mail-privacy-protection-iphf084865c7/ios
[2]Salesforce, State of Sales, Seventh Edition, 2026. https://www.salesforce.com/en/wp-content/uploads/sites/4/documents/reports/sales/salesforce-state-of-sales-report-2026.pdf
Ready to transform your sales pipeline?
See how Prospectory's AI-powered platform can help your team research, reach, and relate to prospects at scale.
Related Articles
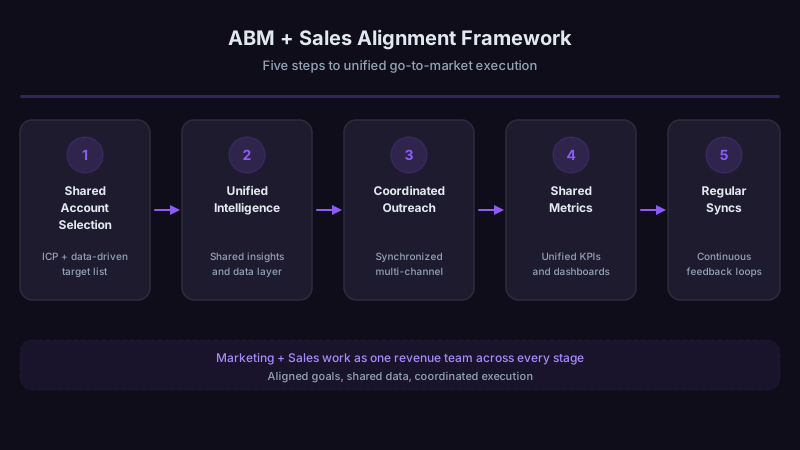
ABM + Sales: How to Align Marketing and Sales on Target Accounts
Build one target-account list, one buyer map, and one operating rhythm that marketing and sales can use together.
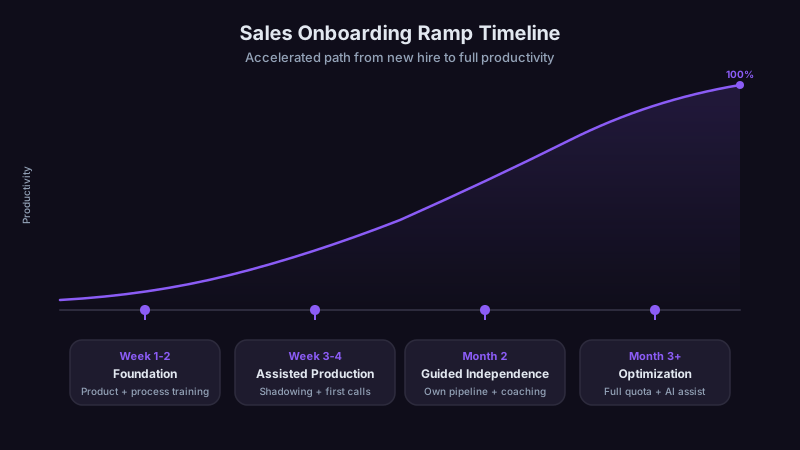
Cutting Sales Ramp Time: The AI-Assisted Onboarding Playbook
New sales reps can take months to reach full productivity. Learn how structured, AI-assisted onboarding can shorten that timeline.
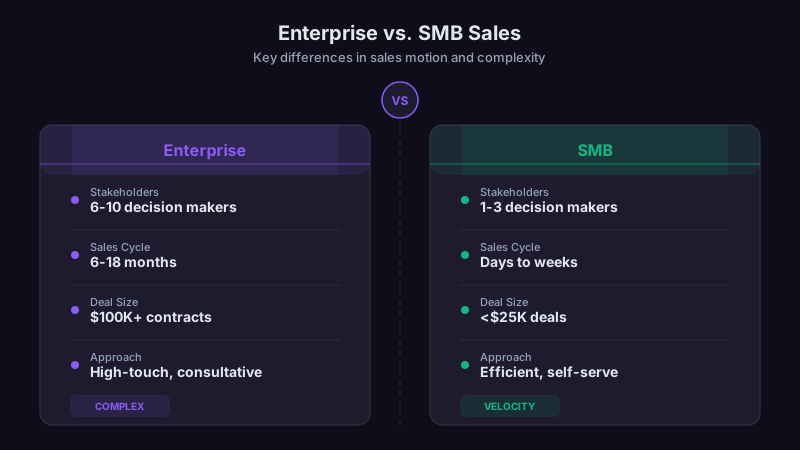
Enterprise vs. SMB Sales: Why Your GTM Motion Needs Different Approaches
One-size-fits-all sales strategies fail. Learn how to build distinct motions for enterprise and SMB segments.