Signal Stacking: How to Combine Buying Indicators Instead of Chasing Single Signals
A single buying signal is easy to misread. Learn how to combine concurrent signals from different categories, weight and decay them, and test whether stacked accounts convert better in your pipeline.
Many sales teams add signal sources faster than they add judgment about them. Website visits, intent topics, job postings, funding news, and review-site activity all flow into the CRM, and reps get a stream of alerts. When every alert triggers the same response, reps learn to ignore them.
The problem is not the data. It is treating each signal as if it existed in isolation. A pricing page visit gets the same response as a competitor comparison. A job posting triggers the same cadence as a contract expiration.
Signal stacking addresses this by combining concurrent buying indicators into one account-level view. The working hypothesis is simple: one signal may only mean someone is curious, while several signals from different categories in a short window may mean an organization is mobilizing. Treat that as a hypothesis to test, not a proven rule. This guide covers the categories worth tracking, how to weight and decay them, and how to test the model against your own outcomes.
Why Single Signals Mislead
Consider a typical example. The VP of Engineering at a target account visits your pricing page. An automated email goes out within the hour. No response.
What the single alert missed: the same company had posted several new sales roles, its CEO had talked publicly about investing in outbound, and two other people at the company had downloaded your competitor comparison guide that week. Each signal alone is ambiguous. Together, they describe a company building a sales motion and evaluating tools to support it.
A stacking model would have flagged that account as a priority on the day the pattern formed, and the rep would have opened with context instead of a generic follow-up.
A single signal may only mean someone is curious. Stacked signals from different categories may mean an organization is moving toward a decision. Test that hypothesis against your own pipeline before you build workflows on it.
The Six Signal Categories
These categories cover most of what B2B teams can observe. The value comes from combining them, not from any one of them.
1. Research intent (what they are researching)
Research intent shows that people at an account are evaluating your category, not just reading one article.
Third-party sources capture this in different ways. Bombora describes its intent data as derived from a Data Co-op made up of thousands of media destinations, including publishers, B2B brands, and premium data providers [1]. G2 says its Buyer Intent signals come from actions on G2 such as product and category page views, competitor comparisons, pricing page engagement, and review consumption [2].
- Strong: category research on review sites, competitor comparisons, repeated visits to your pricing or case study pages
- Moderate: research on topics closely tied to the problem you solve
- Weak: a single blog visit or one content download
2. Organizational triggers (what is changing inside the company)
- Strong: a new executive in the department you sell to; a recent funding round
- Moderate: job postings for roles your product supports; restructuring of a relevant team
- Weak: general company news, office moves
New executives often review tools, processes, and vendors early in their tenure. Reaching them while they are forming their plan is usually more useful than reaching them once they are executing it.
3. Technology signals (what is changing in their stack)
- Strong: removing a competitor's product; adopting a technology that integrates with yours
- Moderate: signs that a competitor contract is approaching renewal
- Weak: technology adoption unrelated to your category
4. Engagement signals (how they interact with you)
These are easy to over-weight because they are the most visible.
- Strong: several people from the same account engaging in a short window; return visits to pricing
- Moderate: email replies, LinkedIn engagement, webinar attendance
- Weak: one email open, one site visit, a social follow
5. Community signals (what they say in public)
- Strong: posting publicly about the exact problem you solve
- Moderate: asking peers for vendor recommendations
- Weak: general industry commentary
6. Competitive signals (what they do with your competitors)
- Strong: active competitor evaluation; a known contract expiration
- Moderate: attending competitor events
- Weak: one-off competitor content
The Scoring Framework
Treat the weights below as a starting hypothesis. Calibrate them against your own outcomes.
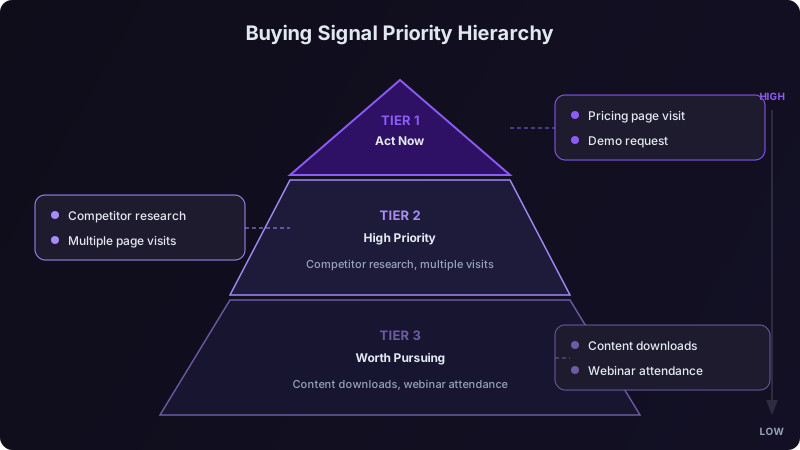
Tier 1, 5 points each (strong purchase indicators)
- Several stakeholders from one account researching your category on review sites
- Competitor product removal or a known contract expiration
- A new executive plus job postings in the relevant department
- An inbound demo request from a target account
Tier 2, 3 points each (active evaluation indicators)
- A recent funding round
- A single new senior hire in a relevant department
- Repeated pricing page visits within a week
- Review-site category research
- A technology change that signals modernization
Tier 3, 1 point each (awareness indicators)
- A single content download
- One-off engagement with your content
- Attending an event where you present
Time decay: signals expire
A pricing visit from three months ago should not count the same as one from yesterday. Give each category a half-life that matches how quickly that kind of signal goes stale. The values below are starting assumptions, not measured results:
| Signal Category | Starting Half-Life | Drop From Score After |
|---|---|---|
| Research intent | 7 days | 30 days |
| Engagement | 5 days | 21 days |
| Organizational triggers | 21 days | 60 days |
| Technology | 30 days | 90 days |
| Competitive | 10 days | 30 days |
| Community | 14 days | 45 days |
Recalculate scores daily so that an account whose activity stopped falls back down the list on its own.
Threshold Playbooks
A score without a response plan is just a number. Tie each band to an owner and an action. The band boundaries and labels below are illustrative starting points built on the example weights above, not validated buying stages. Move the boundaries once you can see which bands actually produced meetings and opportunities in your pipeline.
Keep the account visible without rep involvement.
- Enroll in a short educational sequence with no hard sell
- Alert the owner if the score crosses 7 within two weeks
Treat this band as worth a closer look. A rep engages within two business days with a message tied to the strongest signal.
- Signal briefing: which signals fired, when, and from whom
- Personalized email that references the situation, not the tracking
- LinkedIn connection request to the primary contact
- Phone follow-up a few days later
Several strong signals have appeared together. If a quick review confirms they are real and recent, go multi-threaded.
- Account brief covering stakeholders, stack, and competitive context
- Outreach to two or three stakeholders, each with a different angle
- AE briefed from the start
A score this high may mean the account is already comparing vendors. Confirm it in conversation before acting on that assumption.
- Everything above, plus a same-day account team huddle
- A tailored business case and competitive preparation
- Executive involvement where appropriate
Where Historical Fit Still Matters
Stacked signals tell you when an account may be moving. Historical data, meaning firmographics, technographics, and past purchase records, tells you whether the account could ever buy. The two answer different questions, so use them in that order.
Use fit as a filter, not a forecast. Firmographics work best as exclusion criteria. A company far below the size you can serve, or one built on a platform you do not integrate with, should not reach a rep however many signals it shows. Lookalike models break when they are asked to predict timing: a company that resembles last year's best customer is in different market conditions, with different budget cycles and leadership priorities.
Let contract timing veto noisy intent. Past purchase records show when accounts are likely to review alternatives before a renewal. An account that recently signed a multi-year contract with a competitor may research the category without being able to switch, so treat its research signals as background until the contract window approaches. Inside a known renewal window, the same signals deserve more weight.
Verify more for large, long-cycle deals. A false positive costs more when the deal is big and the cycle is long. Before a full account play on an enterprise account, confirm that it can actually buy: budget capacity, a buying group with more than one senior stakeholder, and evidence that it has purchased comparable software before.
Do not let verification kill response speed. The test is whether the account can buy at all, not whether it perfectly matches your ideal customer profile. Every hour spent perfecting a fit score is an hour a competitor can use to reach the same buyer.
Five Mistakes That Break a Stacking Model
1. Tracking too many signals
Monitoring every available signal type creates noise and alert fatigue. Start with a short list and add a signal only when your closed-won data shows it matters.
2. Ignoring velocity
Five signals spread over six months is background noise. Five signals in two weeks is an event. Weight how fast the score is rising, not just its level.
3. Using one weight profile for every segment
A funding round can matter a lot for a growth-stage company and very little for a large enterprise. Keep separate weight profiles for each segment you sell to.
4. Never recalibrating
Weights are hypotheses. Each quarter, compare the signals present on closed-won and closed-lost deals and adjust.
5. Feeding the model bad data
A score is only as good as its inputs. In Salesforce's seventh State of Sales survey, 46% of sales professionals with AI agents said data quality issues hurt their sales [3]. Deduplicate accounts and normalize domains before you score anything.
A 90-Day Implementation Plan
| Weeks | Focus | Output |
|---|---|---|
| 1 to 3 | Pull recent closed-won and closed-lost deals and list the signals visible before the first meeting | Baseline: which signals appeared on wins vs. losses |
| 4 to 6 | Build the first scoring model in a spreadsheet with initial weights | Three bands with a simple playbook each |
| 7 to 9 | Connect your main sources (website analytics, an intent provider, CRM activity) and route alerts to owners | Reps receive signal briefings in their daily tools |
| 10 to 12 | Review every high-scoring account and its outcome | Adjusted weights and a pruned signal list |
Your first stacking model does not need to be sophisticated. A spreadsheet that combines a few signal types and routes alerts to the right owner is enough to test whether stacked accounts convert better in your pipeline. Get the logic right before you invest in automation.
The Competitive Reality
Many teams can buy the same intent data, track the same website visitors, and monitor the same job postings and funding announcements. The difference is in how signals are combined, how quickly they reach the right person, and whether the team checks the model against real outcomes. Signal stacking is a method for doing that well, and it only earns its place once your own results support it. Measure it against your own baseline and keep the parts that work.
References
[1]Bombora, Company Surge Intent data. https://bombora.com/intent/
[2]G2, Buyer Intent. https://sell.g2.com/buyer-intent
[3]Salesforce, State of Sales, Seventh Edition, 2026. https://www.salesforce.com/en/wp-content/uploads/sites/4/documents/reports/sales/salesforce-state-of-sales-report-2026.pdf
Ready to transform your sales pipeline?
See how Prospectory's AI-powered platform can help your team research, reach, and relate to prospects at scale.
Related Articles
AI Sales Forecasting: Why Your Pipeline Predictions Are Wrong (And How to Fix Them)
Most sales forecasts miss because they rest on rep optimism and stale CRM data. Learn how AI forecasting uses engagement and pipeline signals, and how to commit deals on buyer evidence.
Buying Signals 101: How to Identify Prospects Who Are Ready to Buy Now
Stop guessing which accounts to pursue. Learn how to use intent data and buying signals to focus on prospects actively researching solutions like yours.
The 11-Minute Speed-to-Lead Window: Instrument It, Then Prove It
How to treat an 11-minute response target as an operating goal: signal tiers worth interrupting for, CRM timestamps that separate routing lag from rep lag, and proof of lift.