ICP Scoring Models That Actually Predict Revenue
How to build an ICP scoring model that combines firmographics, technographics, and behavioral signals, with example weightings and decay rules you can test against your own deals.
Picture three sales teams with identical ICP criteria: the same target firmographics, industry verticals, and revenue bands. One scores accounts on real-time signals of buying readiness. One uses a static spreadsheet of "good fit" criteria. One still qualifies leads against a demographic wishlist from years ago. Their results can diverge sharply.
Traditional ICP models tell you who looks like a customer. Modern scoring models tell you who's ready to become one. That distinction is where pipeline efficiency comes from.
Quick Answer: How To Apply Scoring To Revenue Bands
Apply scoring to revenue bands by using company revenue as a capacity signal, not as the full ICP score. Start by assigning each account to a revenue band, map that band to expected annual contract value and buying process, then adjust the score with technographic fit and fresh buying signals. A large company with no trigger event should not outrank a smaller company that just hired a RevOps leader, visited your pricing page, and started comparing your category.
| Annual revenue band (USD) | What it usually indicates | Base fit score | Best motion | Signals that should change priority |
|---|---|---|---|---|
| Under 10M | Founder-led or small team buying, limited procurement | 10-20 | Founder or department-head outreach | New funding, first sales hire, first CRM or marketplace listing |
| 10M to 50M | Budget exists, but sales process is still lean | 20-35 | SDR plus AE sequence | Hiring surge, new VP, repeated category research, competitor churn |
| 50M to 250M | Mature GTM team, defined budget owners | 35-50 | Account-based outreach | RevOps hire, stack consolidation, expansion region, pricing-page visits |
| 250M to 1B | Buying committee and procurement are likely | 45-60 | Multi-threaded enterprise motion | Leadership change, compliance deadline, new data platform, partner program |
| Over 1B | High capacity, slower cycles, strong proof requirements | 50-65 | Executive account plan | Transformation initiative, acquisition, cloud migration, public strategic move |
Revenue band scoring works best when it caps the account's starting score and lets real-time intent determine urgency. In the example weightings below, revenue band contributes a minority of the model, while technographics and behavioral signals determine whether the account should be worked this week.
Why Traditional ICP Models Fail to Predict Revenue
Most companies build ICPs by analyzing closed-won deals and extracting common firmographic traits: company size, industry, geographic location, revenue range. Then they go hunting for more companies that match those characteristics.
The problem isn't that firmographics don't matter, they do. The problem is that company size and industry data tell you nothing about timing. A perfectly-fit account that isn't actively evaluating solutions will ghost your outreach just as fast as a poor-fit prospect.
Static firmographic scoring misses the behavioral signals that actually indicate buying readiness. You're prioritizing accounts based on who they are rather than what they're doing. Meanwhile, your competitors are reaching out to the same accounts the week they announce Series B funding, hire a new CRO, or post three job openings for revenue operations roles.
Most ICP frameworks score accounts at a single point in time, then treat that score as permanent. But buying signals decay rapidly. Hiring data from three months ago says much less about today than it did when it was fresh. A funding announcement from last quarter may no longer indicate an active buying window. Leadership changes open evaluation periods that close within months.
The market has figured this out. Generic demographic targeting earns few replies, while outreach that references a specific trigger, such as funding, hiring, or a tech stack change, gives the buyer a reason to answer. Measure the gap in your own data.
The Three-Layer ICP Scoring Framework
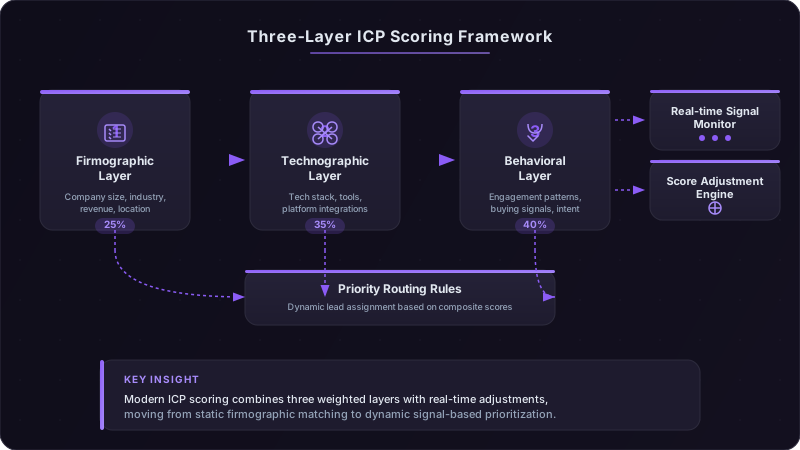
Modern revenue teams layer three types of data to predict which accounts will close, how fast, and at what deal size. Each layer contributes different information, and the relative weighting matters enormously.
Layer 1: Firmographic Foundation (example weight: 0.20 to 0.30)
This is your baseline. Company size, industry, revenue range, geographic location, employee count. These factors determine whether an account can buy, whether they have budget authority, whether your product fits their business model, whether you can legally serve them.
Firmographics answer: "Is this a viable customer?" They don't answer: "Should we pursue them right now?"
Layer 2: Technographic Indicators (example weight: 0.25 to 0.45)
The tools a company uses reveal far more than their industry classification. Tech stack data tells you about technical sophistication, integration requirements, infrastructure maturity, and, critically, budget allocation priorities.
A company running Salesforce Enterprise Edition with Outreach, Gong, and a modern data warehouse has different buying patterns than a company using HubSpot Starter with spreadsheets. One has proven they'll invest in revenue infrastructure. The other hasn't.
Technographics answer: "How do they buy, and what will they spend?"
Layer 3: Behavioral Signals (example weight: 0.35 to 0.45)
This is where revenue prediction happens. Behavioral signals indicate timing, whether an account is actively evaluating solutions, experiencing pain, or entering a buying window.
Hiring velocity in revenue roles. Funding announcements. Leadership changes. Website visitor patterns from target accounts. Content engagement. Intent data showing research activity. These signals go stale within weeks to a few months, which means they're either actionable now or they're noise.
Behavioral signals answer: "Are they ready to buy this quarter?"
Real-time signal monitoring detects when accounts move from "good fit" to "active opportunity." An account might score 65/100 based on firmographics and technographics, decent but not urgent. Then they hire a VP of Sales Operations, announce a Series B, and start researching "sales intelligence platforms" on G2. Now they're 88/100 and should get outreach within 24 hours.
Test whether signal-qualified accounts convert better and faster than accounts that only match on demographics in your own pipeline. If they do, the difference compounds across cycle length, win rate, and deal size.
Example Weight Matrices for Three Business Types
Here are three illustrative weightings for different kinds of businesses. They are starting points to test, not results from named companies. All three put technographic and behavioral signals ahead of firmographics.
Example A: SaaS Infrastructure Platform
- Firmographic weight: 0.20
- Technographic weight: 0.45
- Behavioral weight: 0.35
A platform like this sells to engineering and platform teams, so tech stack sophistication is the primary predictor of deal size and close rate. Its best customers tend to run modern data infrastructure, Snowflake, Databricks, cloud-native architecture. Behavioral signals like hiring data engineers or announcing infrastructure investments indicate buying windows.
Example B: Sales Enablement Software
- Firmographic weight: 0.30
- Technographic weight: 0.25
- Behavioral weight: 0.45
Its buyers are sales leaders making people-focused investments. Hiring velocity in sales roles and leadership changes predict urgency better than tech stack. When a company hires a new CRO or announces plans to double their sales team, that can open a buying window for enablement tools.
Example C: Data Analytics Platform
- Firmographic weight: 0.25
- Technographic weight: 0.40
- Behavioral weight: 0.35
It needs companies with data maturity, existing warehouses, analytics teams, BI tools. But behavioral signals like data engineering hires or failed analytics initiatives create urgency. Without the tech foundation, the deal won't happen. Without the behavioral trigger, it won't happen this year.
Consider adjusting weights by deal stage. Early pipeline scoring weights behavioral signals heavily, you're trying to identify active opportunities. Late-stage scoring weights technographics more heavily, you're assessing implementation complexity and expansion potential.
| Layer | Example A | Example B | Example C | Average |
|---|---|---|---|---|
| Firmographic | 0.20 | 0.30 | 0.25 | 0.25 |
| Technographic | 0.45 | 0.25 | 0.40 | 0.37 |
| Behavioral | 0.35 | 0.45 | 0.35 | 0.38 |
| Top Signal | Cloud infra | Hiring velocity | Data team growth | Varies |
In all three examples, firmographics stay at a weight of 0.30 or below, and behavioral and technographic signals carry most of the weight. Validate your own weights by backtesting, as described below.
Technographic Scoring: What Tech Stack Tells You About Revenue Potential
CRM sophistication can be a useful signal of deal size. A company running Salesforce Enterprise Edition with Sales Cloud, Service Cloud, and Marketing Cloud has fundamentally different buying patterns than a company using Salesforce Essentials or HubSpot Starter.
Check this against your own closed deals: compare ACV and procurement time for accounts with mature CRM implementations (for example, multi-cloud Salesforce or enterprise HubSpot with automation) against the rest. Any difference is a signal of budget priorities and technical sophistication, not a cause.
Marketing automation maturity is another useful signal. Companies using Marketo, Pardot, or HubSpot Marketing Hub Professional don't just have bigger marketing budgets, they have established buying processes, procurement workflows, and vendor evaluation frameworks. They know how to buy B2B software at scale.
Data infrastructure investments signal budget availability and buying authority. If a company runs a significant Snowflake or Databricks footprint, they have data engineering teams, analytics budget, and executive sponsorship for technical initiatives. You're not selling to a team that's still exporting reports to Excel.
Integration requirements can be scored algorithmically to predict implementation complexity. Count the number of systems you'll need to integrate with, assess API quality for each, calculate data volume, and you can estimate the implementation timeline. Implementation complexity tends to lengthen sales cycles, so track that relationship in your own deals.
Tech stack decay signals indicate urgency. When a company is using legacy tools while competitors modernize, that creates competitive pressure. If everyone in their industry has adopted modern sales intelligence except them, they're aware of the gap. They're either actively evaluating replacements or about to start.
Not all tech stacks signal opportunity. Companies with many point solutions in the same category (email tools, enrichment tools, intent providers) are usually over-invested in patchwork systems without the organizational will to consolidate. They'll demo your product, then renew their existing contracts. Look for companies with gaps in their stack, not companies trying to replace everything.
Scoring Tech Stack Maturity
An example 0-10 scale for technographic scoring across four dimensions:
- 1CRM Sophistication (0-10): Essentials = 3, Professional = 5, Enterprise = 7, Enterprise + Advanced Features = 9-10
- 2Marketing Automation (0-10): None = 0, Basic email = 3, Full platform = 7, Multi-channel + ABM = 10
- 3Data Infrastructure (0-10): Spreadsheets = 2, Basic warehouse = 5, Modern stack = 8, Advanced analytics = 10
- 4Revenue Tools (0-10): Count sales enablement, intelligence, and analytics tools, score based on maturity
In this example, an account scoring high across all four dimensions likely has the technical foundation to evaluate, procure, and implement your solution efficiently, while low scorers may struggle with procurement, integration, and adoption regardless of interest. Set the thresholds from your own closed deals.
Behavioral Signal Scoring: Timing Signals
Hiring velocity in revenue roles is a strong timing signal. When a company posts jobs for SDRs, AEs, sales engineers, or revenue operations roles, they're scaling their go-to-market motion. Scaling means buying infrastructure to support that growth.
The signal strength varies by role. A VP of Sales Operations hire often opens an evaluation window where they'll assess the entire tech stack and make replacement decisions. An SDR hire suggests capacity expansion, which creates demand for prospecting tools. A sales engineer hire indicates deal complexity is increasing, which might mean they need better demo environments or technical documentation tools.
Funding announcements can open buying windows. Series A, B, and C rounds come with board pressure to deploy capital into growth initiatives. The quarter immediately following a funding announcement is prime territory for sales infrastructure purchases.
But you need to move fast. The window narrows as budget gets allocated and priorities solidify, and the first sellers in line meet the buyer while budget is still fluid.
Leadership changes create evaluation periods in which new executives rebuild their tech stacks. A new CRO brings opinions about sales methodology, preferred tools, and infrastructure requirements. Within their first few months, they often audit existing systems and start replacing underperforming tools.
Track executive hires through LinkedIn job changes, company announcements, and press releases. In an example model, a new revenue leader adds a block of points to the account's priority score for a few months, then decays back to baseline.
Website visitor patterns from target accounts can foreshadow demo requests. When someone from a target company visits your pricing page, case studies, or integration documentation, they're actively researching. If they return multiple times or visit from different IP addresses (indicating multiple team members), they're in evaluation mode.
First-party website tracking is one of the strongest behavioral indicators you own. Compare demo request rates for accounts with repeat visits against accounts that never visit, and conversion for accounts that read documentation or integration pages against those that only view marketing content.
LinkedIn engagement signals, job postings, content shares, employee posts about challenges, indicate problem awareness. When a company posts publicly about scaling challenges, hiring difficulties, or technical problems your product solves, they're broadcasting intent. They know they have a problem and they're looking for solutions.
Signal Decay Rates and Time-Sensitive Scoring
Every behavioral signal has a predictive half-life. Hiring signals fade over weeks; month-old hiring data is closer to background noise than actionable intelligence.
Funding urgency peaks in the weeks after the announcement, then declines as funding is allocated and budget priorities are set. Late outreach loses most of the timing advantage.
Third-party intent data goes stale quickly. Surge data showing research activity is most useful soon after detection; within a month or so, the research was either exploratory or the decision has been made.
This is why real-time scoring systems matter. Static scoring models treat all signals as equally fresh. Real-time systems adjust account priority as new signals emerge or existing signals expire. An account scoring 75 yesterday might score 82 today because they just posted a job opening, or might drop to 68 because their funding announcement is now 90 days old.
Signal Decay and Real-Time Score Adjustments
The case for real-time scoring is simple: with a static score, you can discover weeks later that an account announced funding, hired a VP of Sales Ops, and signed with a competitor, all while it sat in a nurture queue.
Real-time scoring means signal detection, score adjustment, and routing happen automatically within hours of trigger events. When an enrichment provider detects a funding round or hiring surge at a target account, the system recalculates the score, adjusts their priority tier, and routes them to the appropriate sales sequence.
Here's an illustrative timeline of how signal decay affects scoring:
Week 0: Company announces a Series B. Account score increases from 65 → 85. SDR gets automated alert and task to reach out within 24 hours.
Week 2: Hiring surge detected, four new revenue roles posted. Score increases from 85 → 92. Account moves to top-priority queue.
Week 4: Website visits detected from three different IP addresses at target company. Score holds at 92. SDR sends follow-up sequence.
Week 8: No response to outreach, funding signal decay begins. Score drops from 92 → 78. Account moves to automated nurture sequence.
Week 12: Funding signal fully decayed, hiring roles filled. Score drops to 68. Account remains in database for quarterly rescoring.
Without real-time adjustments, that account would have been scored once at 65, never prioritized, and never received urgent outreach during its buying window.
Building Decay Functions for Different Signal Types
Illustrative starting values to calibrate against your own data:
| Signal Type | Peak Urgency | Half-Life | Full Decay | Action Window |
|---|---|---|---|---|
| Funding | Weeks 3-6 | 8 weeks | 16 weeks | 6-8 weeks |
| Leadership hire | Weeks 4-8 | 10 weeks | 20 weeks | 12-16 weeks |
| Hiring surge | Immediate | 3 weeks | 12 weeks | 4-6 weeks |
| Intent data | Immediate | 3 weeks | 6 weeks | 2-3 weeks |
| Website visits | Immediate | 2 weeks | 4 weeks | 1-2 weeks |
| Tech stack change | Weeks 2-4 | 6 weeks | 12 weeks | 4-8 weeks |
These decay functions feed into automated scoring algorithms that recalculate account priority every 24 hours. Accounts with fresh signals rise to the top. Accounts with decaying signals drop gradually. Accounts with no signals remain at baseline firmographic/technographic scores until new behavioral data emerges.
Building Your Scoring Model: Data Sources and Integration
You need three categories of data to build a predictive scoring model: firmographic, technographic, and behavioral. Each category requires different vendors and integration approaches.
Firmographic Data Sources:
- ZoomInfo provides company size, revenue estimates, employee counts, and org charts
- Clearbit offers real-time company data enrichment via API
- LinkedIn Sales Navigator gives access to employee listings and job postings
A common setup uses one primary firmographic provider, a real-time enrichment API when new accounts enter the CRM, and LinkedIn Sales Navigator for hiring signals and relationship mapping. Compare coverage for your segments before you choose.
Technographic Data Sources:
- BuiltWith detects web technologies and tracks tech stack changes over time
- HG Insights provides installation data for enterprise software and cloud infrastructure
- 6sense offers account-level technology usage and intent signals combined
Technographic data is harder to source and more expensive than firmographics. Data quality is the bottleneck for most scoring models; in Salesforce's seventh State of Sales survey, 74% of sales teams with AI said they are prioritizing data hygiene to support it [1]. Start with basic web-technology detection, then add installation data when you need deeper visibility into infrastructure and backend systems. Measure what share of your target accounts each source actually covers.
Behavioral Signal Sources:
- Bombora intent data tracks content consumption across B2B publisher networks
- G2 buyer intent shows which accounts are actively researching competitors
- First-party website tracking (6sense, Clearbit Reveal, or custom implementation) identifies target account visitors
- LinkedIn Sales Navigator monitors job changes and company updates
- Funding databases (Crunchbase, PitchBook) provide financing and M&A data
Behavioral signals require the most integration work because they come from multiple sources with different data formats and update frequencies. A signal aggregation layer normalizes data from each provider, calculates signal strength, and pushes updates to Salesforce every 24 hours.
CRM Integration and Data Enrichment Workflows
Here is one way to run the scoring model inside Salesforce with custom objects and automation:
- 1Data ingestion: Zapier and Workato push data from external providers into Salesforce custom objects (one for firmographics, one for technographics, one for behavioral signals)
- 1Score calculation: Salesforce Flow calculates weighted scores every 24 hours using record-triggered flows
- 1Signal decay: Scheduled flows run daily to adjust signal strength based on time elapsed since detection
- 1Routing logic: Process Builder assigns accounts to appropriate queues based on score thresholds
This architecture keeps scoring logic centralized and auditable. When you adjust weights or add new signals, you update Flow definitions rather than rebuilding integrations.
Model Validation:
Before deploying any scoring model, backtest it against 18 months of historical data. Pull your closed-won deals from the past year and a half. Score them using your proposed model at the point when they first entered your pipeline. Calculate what percentage of high-scoring accounts (80+) actually closed versus low-scoring accounts (<60).
If your model can't differentiate closed-won from closed-lost deals in historical data, it won't predict future outcomes. Set a target for how much better high-scoring accounts must close than low-scoring ones, and refine the model until the backtest clears it.
From Scoring to Action: Routing and Prioritization Rules
Scoring accounts is useless if it doesn't change seller behavior. The model needs to trigger specific actions at specific score thresholds, otherwise, it's just a number in a field that nobody looks at.
High-priority accounts (80+ score): Immediate SDR outreach within 24 hours of reaching threshold. Multi-channel sequence: personalized email, LinkedIn connection, phone call attempt. These accounts get seven touches over 14 days. Account Executive loops in on touch four if prospect engages. ABM spend allocated: display ads, LinkedIn sponsored content, personalized direct mail for C-level contacts.
Mid-tier accounts (60-79 score): Automated nurture sequence with signal monitoring. Monthly touchpoints via email with relevant content. Quarterly check-ins from SDRs to assess timing. When behavioral signals strengthen, accounts auto-promote to high-priority tier. No ABM spend, stay in database for score monitoring.
Low-priority accounts (<60 score): Remain in database for quarterly rescoring as circumstances change. Minimal outreach, maybe one email per quarter with high-value content. When firmographic or technographic factors change (company grows, adopts new tech), accounts can move up tiers. These accounts aren't bad fits, they're just not ready yet.
One option is to split account-based marketing spend across score tiers, for example in a 3:2:1 ratio from the top tier down, so paid media goes to accounts that show buying signals.
Signal-qualified accounts get multi-channel sequences because they're worth the effort. Email-only sequences work fine for demographic matches with weak signals. But when an account is actively hiring, just raised funding, and visiting your website, you deploy every channel: email, LinkedIn, phone, direct mail, and targeted ads.
Converting Score Changes Into Seller Workflows
The hardest part of implementing predictive scoring isn't building the model, it's getting sellers to trust it and act on it. SDRs have their own prospecting routines, preferred account lists, and territory biases. Asking them to drop everything and call a newly-prioritized account feels disruptive.
Automated task creation and score change notifications help. When an account crosses the 80-point threshold, Salesforce automatically:
- Creates a task for the assigned SDR due today
- Sends a Slack notification with the account name and trigger event
- Generates a personalized outreach template referencing the specific signal
The SDR doesn't have to monitor scores, understand the model, or decide whether the account is worth pursuing. The system tells them: "This account just became high-priority because they hired a VP of Sales Ops and raised a Series B. Here's a draft email referencing both signals. Send it today."
That level of automation removes friction and drives adoption. Track the share of score-triggered tasks your SDRs act on before and after you automate.
References
[1]Salesforce, State of Sales, Seventh Edition, 2026. https://www.salesforce.com/en/wp-content/uploads/sites/4/documents/reports/sales/salesforce-state-of-sales-report-2026.pdf
Ready to transform your sales pipeline?
See how Prospectory's AI-powered platform can help your team research, reach, and relate to prospects at scale.
Related Articles
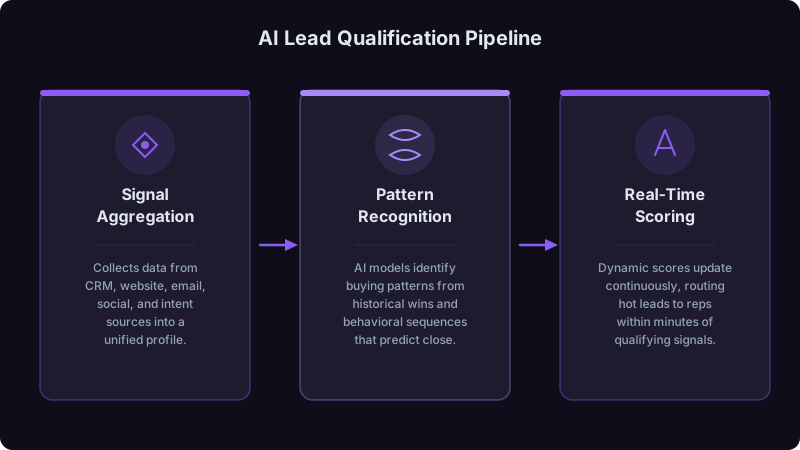
AI Lead Qualification: Separating Hot Prospects from Time Wasters
Too much rep time goes to leads that will never buy. Learn how AI qualification helps identify real opportunities faster.
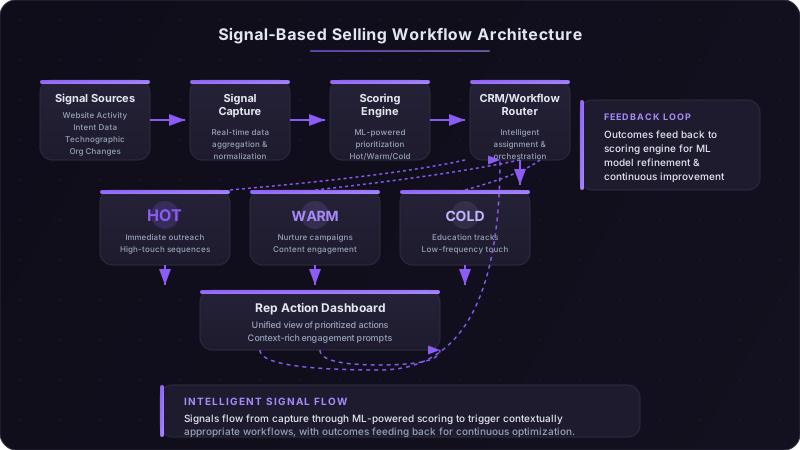
Building a Signal-Based Selling Motion from Scratch
A practical playbook for sales teams transitioning from spray-and-pray list-based outbound to a signal-driven approach that actually converts.
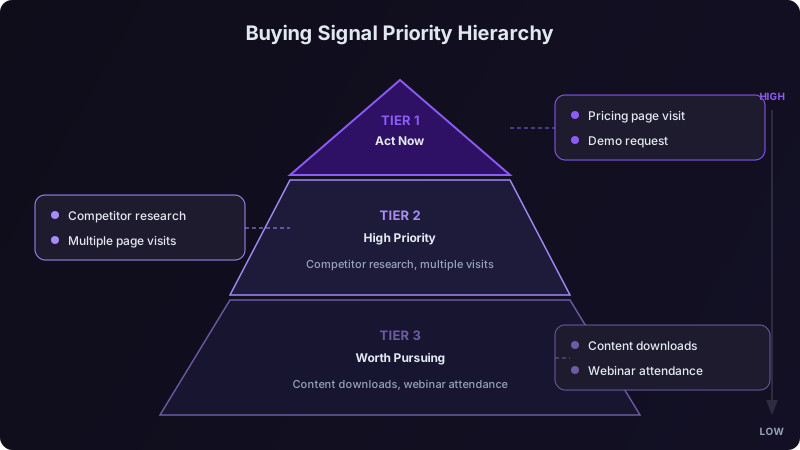
Buying Signals 101: How to Identify Prospects Who Are Ready to Buy Now
Stop guessing which accounts to pursue. Learn how to use intent data and buying signals to focus on prospects actively researching solutions like yours.